NEW QUESTION 21
Case Study 1 – Fabrikam Inc.
Background
Fabrikam Inc. is a global retail analytics company that provides AI-driven demand forecasting and product recommendation services to online retailers. The company is modernizing its solution to run entirely on Microsoft Azure.
The platform ingests transaction data, generates embeddings for semantic retrieval, performs vector similarity search, and returns product recommendations through containerized microservices. Developers use Python and Azure SDKs. Operations teams manage container orchestration, scaling, monitoring, and security.
The solution must meet strict performance, scalability, and security requirements.
Current environment
Application architecture
The Recommendation engine is a customer-facing HTTP API running as a containerized Python application. The engine is deployed to Azure Container Apps (ACA).
Embeddings are stored in Azure Database for PostgreSQL by using pgvector.
Semantic retrieval uses metadata filtering combined with vector similarity search.
Azure Managed Redis is used as a caching layer.
Front-end and API workloads are deployed to Azure Container Apps (ACA).
Batch model retraining workloads run in Azure Kubernetes Service (AKS).
Container and CI/CD
Container images are stored in Azure Container Registry (ACR).
CI/CD uses ACR Tasks to build images on commit.
ACA environments support revision management.
AKS workloads are deployed by using Kubernetes manifest files stored in Git.
Monitoring
Logs are collected in Azure Monitor.
Teams inspect container logs and Kubernetes events when troubleshooting.
Developers write KQL queries to analyze latency spikes.
Business requirements
Customer experience: Maintain a seamless, low-latency recommendation experience for end- users, even during unpredictable seasonal traffic spikes.
Operational cost efficiency: Minimize compute expenditures by deallocating resources during periods of inactivity and by preventing runaway scaling costs.
Data integrity and freshness: Ensure that product recommendations always reflect the most current catalog metadata and pricing to prevent customer dissatisfaction.
Security and compliance: Adhere to a Zero Trust security model by eliminating long-lived credentials and centralizing the management of all sensitive secrets.
Global scalability: Support the rapid ingestion of millions of new product embeddings daily without degrading query performance for existing retailers.
Technical requirements
Performance: Semantic search latency must remain under 200 milliseconds at peak load.
Database optimization: Use pgvector for embeddings and implement metadata filtering to reduce compute overhead. Configure compute and memory appropriately for vector workloads to ensure high-dimensional index residency in RAM and efficient mathematical throughput. Vector similarity calculations must be performed only against products that satisfy mandatory metadata constraints.
Database performance: Database connections must support high concurrency with minimal latency through the implementation of connection optimization.
Data load strategy: To ensure maximum ingestion throughput, secondary indexes must be applied only after bulk loading of embeddings is complete.
Caching: Redis cache entries must expire automatically after 10 minutes. Implement a reactive mechanism to invalidate cache entries upon metadata updates.
Identity: Use managed identities for all service-to-service and service-to-database authentication.
Plain-text credentials in configuration files are strictly prohibited.
Secret management: All secrets must be stored centrally. Secrets must be rotated automatically by using a centralized lifecycle policy.
Scaling: Use Kubernetes event-driven autoscaling (KEDA) for event-driven scaling. The Recommendation API must scale based on HTTP traffic, while batch jobs must scale based on queue length and support scale-to-zero.
CI/CD: All images must be stored in Azure Container Registry. Use ACR Tasks to automate image builds triggered by source code commits.
Monitoring: Use KQL to analyze performance telemetry and troubleshoot microservice connectivity failures. Inspect logs and events when troubleshooting AKS and ACA.
Drag and Drop Question
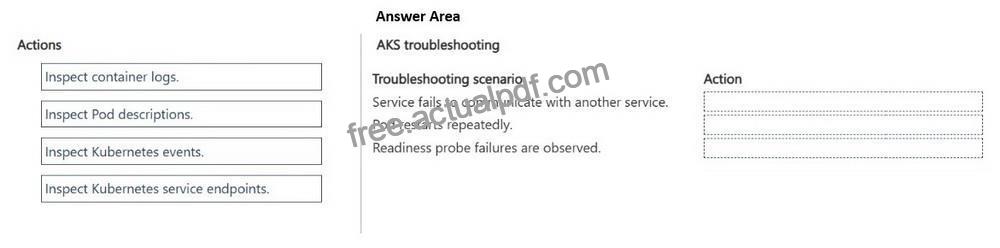
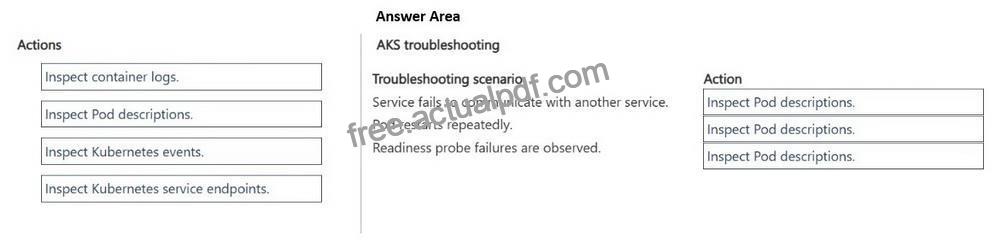
You need to troubleshoot connectivity failures between microservices running in AKS.
Which troubleshooting actions should you perform? To answer, move the appropriate action to the correct troubleshooting scenario. You may use each action once, more than once, or not at all. You may need to move the split bar between panes or scroll to view content.
NOTE: Each correct selection is worth one point.
Explanation:
Box 1: Inspect Pod descriptions
Inspecting Pod descriptions is an excellent and standard first troubleshooting step to fix inter- service communication failures in Azure Kubernetes Service (AKS).
To remedy a communication failure between containerized microservices in Azure Kubernetes Service (AKS), the first and most direct troubleshooting action is to verify and debug core Kubernetes networking and DNS resolution within the cluster.
1. Check Pod Status: Ensure both the source and target pods are actively running.
Run kubectl get pods -n <namespace> to check for crash loops.
2. Verify DNS Resolution
Etc.
Box 2: Inspect Pod descriptions
To troubleshoot sudden or frequent Pod restarts in Azure Kubernetes Service (AKS), you should inspect Pod descriptions first, as they contain the Last State, Exit Code, and Reason (such as OOMKilled) for the restarted container.
Pod descriptions (Correct Choice): This is the best starting point. Running kubectl describe pod
<pod-name> provides a comprehensive status overview. It specifically reveals the Last State of the container, the Exit Code, and the Termination Reason (e.g., OOMKilled if it exceeded memory limits, or Error). It also displays the Pod’s recent lifecycle events at the bottom.
Incorrect:
Container logs: While highly valuable, logs are only useful if the application managed to write an error message to stdout or stderr before crashing. If a Pod is killed externally by the system (such as an Out-Of-Memory event), the container logs will suddenly stop without showing the root cause.
Box 3: Inspect Pod descriptions
To address readiness probe failures, the most immediate and effective troubleshooting action is to inspect the Pod descriptions.
Pod descriptions: This is the correct starting point. Running kubectl describe pod <pod-name> provides a dedicated Events section at the bottom of the output. This section explicitly details exactly why a readiness probe failed, including the specific error codes, timeouts, or connection refusals, and lists the exact timestamps of the failures.
Reference:
https://blog.devgenius.io/k8s-troubleshooting-pod-in-containercreating-status-e89e093d996e?gi=e4e93cbfd5d6
https://learn.microsoft.com/en-us/troubleshoot/azure/azure-kubernetes/availability-performance/troubleshoot-oomkilled-aks-clusters